For the tanh verilog code, first we need to understand the basic about it and where we are applying it.
for understanding and plotting we will take from matlab platform.
lets say, X is vary from -5 to 5 so its tanh values and its plot as
x = -5:1:5;
tanh_val=tanh(x);
plot(tanh_val), grid on
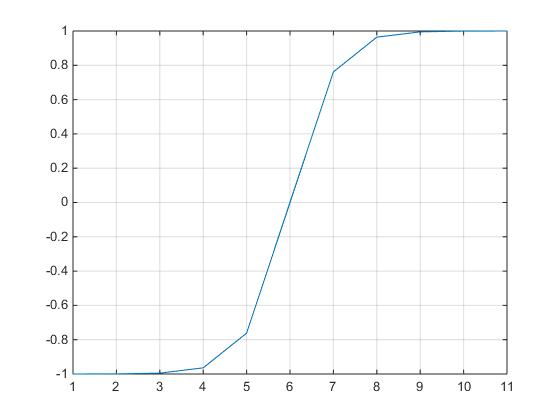 from this figure it is shown that the range of tanh is from -1 to 1, logically every trigonometry function has range -1 to 1.
for better representation of the same we take one more range for plot
x = -15:1:15;
tanh_val=tanh(x);
plot(tanh_val), grid on
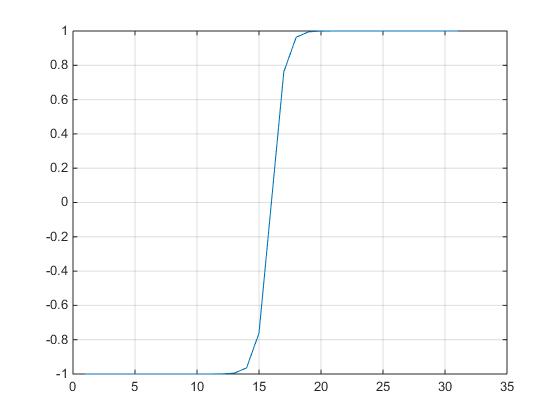 One more conclution we can draw from this plot for any value of x which is > -+6 would result in -1 and +1, as
tanh(-6) ~ -1 and tanh(+6) ~ +1, so the important range of x is between -6 to +6.
If your input to tanh is in this range then its ok, else you have to map your input in to this range. Let it be we will see what we can do about it in later time.
so, for the verilog code. we can use ROM for storing these tanh function values. For that we need to convert it in to hex either into floating or fixed point, following code shows the conversion for Q16.16 format for hex values.
%%
x = -5:10/1024:5-(10/1024); % 1024 is the depth of ROM ,
act_val=tanh(x);
plot(act_val), grid on
struct.mode = ‘fixed’;
struct.roundmode = ‘ceil’;
struct.overflowmode = ‘saturate’;
struct.format = [32 16];
q = quantizer(struct);
t = [];
formatSpec = ‘%+2.4f\n’;
%——————————–
for pnty=1:size(x,2)
t1 = dec2hex(bin2dec(num2bin(q,act_val(pnty))),8)
t = [t ; t1 ‘ //’ num2str(act_val(pnty),formatSpec)];
end
%——————————————–
t variable contains the all ROM entries , you can use these values for memory file for ROM. z_act_fun_file.hex
module z_act_fun
(
input [9:0] addr,
output signed [31:0] data
);
reg [31:0] mem [0:1023]; // 1024 locations of 32-bit data
initial begin
$readmemh(“z_act_fun_file.hex”, mem); // Read memory initialization data from file
end
assign data = mem[addr];
endmodule
As we said we need to take care of rang, if there is need of rang mapping, please ref the link http://learnwebgl.brown37.net/08_projections/projections_mapping.html
Given a value p in the range A to B, calculate a point q in the range C to D that is in the same relative place.
- Solution 1:
- Since scaling is always relative to the origin, and we need to scale the range from A to B to make it the same size as the range C to D, let’s shift the range A to B to the origin. We can do this by subtracting A from p.
p-A - Scale p by the ratio of the range sizes, (D-C)/(B-A).
(p-A)*(D-C)/(B-A) - Now shift this value to the start of the C to D range by adding C. Therefore, our equation is
q = (p-A)*(D-C)/(B-A) + C
- Since scaling is always relative to the origin, and we need to scale the range from A to B to make it the same size as the range C to D, let’s shift the range A to B to the origin. We can do this by subtracting A from p.
- Solution 2:
- Because the relationship between the points p and q must maintain relative distances, the ratio of their distances must be equal to the ratio of the range sizes. Therefore,
(p-A)/(q-C) = (B-A)/(D-C) - If you solve this equation for q, you get
q = (p-A)*(D-C)/(B-A) + C
- Because the relationship between the points p and q must maintain relative distances, the ratio of their distances must be equal to the ratio of the range sizes. Therefore,
If you rearrange the terms in this equation, you end up with a scale factor and an offset. Specially,
scale = (D-C)/(B-A)
offset = -A*(D-C)/(B-A) + C
q = p*scale + offset
Let’s work a specific example. We want to take the values between 12 and 22 and map them into a range from 6 to 7. The ratio between these two ranges is (7-6)/(22-12) = 1/10. The offset is -12*(1/10) + 6 = 4.8. Our linear mapping formula become `q = p*(1/10) + 4.8. If you apply the formula to all the whole numbers in the range 12 to 22, you get equally spaced values in the range 6 to 7, as shown below.
| 12 | 13 | 14 | 15 | 16 | 17 | 18 | 19 | 20 | 21 | 22 |
| 6.0 | 6.1 | 6.2 | 6.3 | 6.4 | 6.5 | 6.6 | 6.7 | 6.8 | 6.9 | 7 |
Hope you clear about it, Please do comment, will reply with in 24hrs.